

Weekly Market Commentary - July 15, 2024
KEY THEMES FOR STOCKS IN THE SECOND HALF OF 2024
Jeffrey Buchbinder, CFA, Chief Equity Strategist
Outlook 2024: A Turning Point, released in December 2023, featured our perspective on how stocks might respond to turning points in inflation and monetary policy. That response was quite positive, as we now know, as easing inflation, anticipation of Federal Reserve (Fed) rate cuts, increasing chances of a soft landing for the U.S. economy, and artificial intelligence (AI) excitement combined to send stocks up double-digits over the first six months of 2024. Now past the halfway mark, a lot of good news is priced in, valuations are elevated, and monetary policy may not offer much opportunity for upside. If stocks are going to add to first-half gains in the second half, earnings must play a key role.
KEY THEMES FOR THE SECOND HALF
With the release of the LPL Research Midyear Outlook 2024: Still Waiting for the Turn, in this week’s commentary, we pull out key themes from the publication and add some context for our views given stocks have continued to rally — with Thursday a glaring exception as stocks sold off, somewhat surprisingly, after a good consumer inflation report.
At a high level, we believe this advice can help prepare investors for the second half:
- Earnings are key. Second-half gains will likely require corporate profits to continue to exceed expectations.
- Valuations are a headwind. Most good news is priced in, we believe, and any second-half gains could be modest.
- Expect more volatility. Market corrections and pullbacks are normal and should be anticipated, especially in a late-cycle economy with a U.S. presidential election approaching.
- Be patient. Consider waiting for dips before adding equity exposure. That said, the strong momentum and positive earnings trends to date are consistent with staying fully invested, and diversified in equities relative to your specific targets.
KEY SECOND HALF INSIGHTS
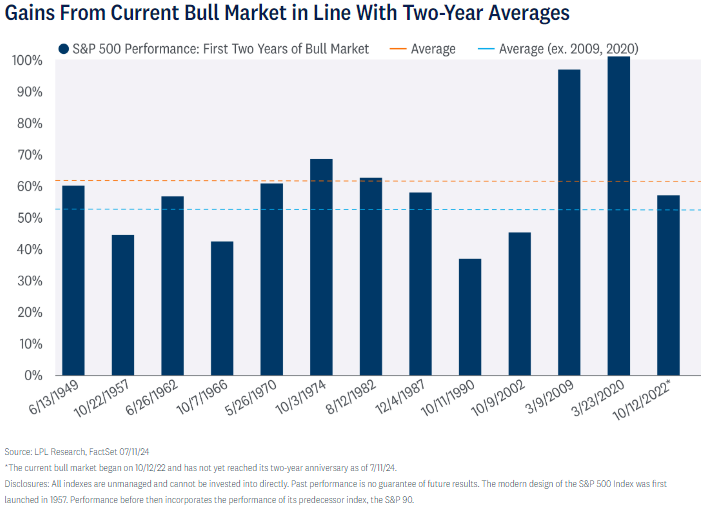
Market cycles suggest upside may be limited. When assessing how much this stock rally may have left in it for the next six months, it’s helpful to refer to historical performance cycles. One such cycle we noted in the Outlook publication was the simple bull market cycle. The S&P 500 has gained about 56% during this bull market through July 11, and has yet to reach its second birthday. Historically, two-year-old bull markets have gained an average of 60%. Excluding the massive rallies off the major lows in 2009 and 2020, the average is 53%, suggesting investors may have to be patient as they wait for the next leg of this bull market to come through.
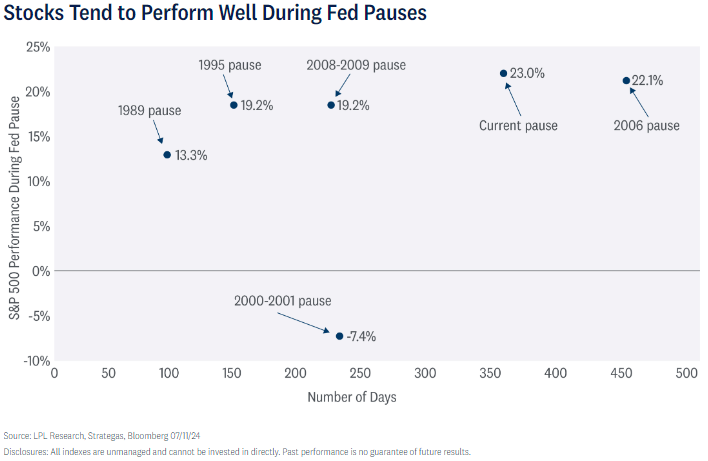
The monetary policy cycle offers a similar message. The current Fed pause, now over 350 days, is the second-longest in modern market history, trailing only 2006–07 (446 days). During the last six pauses, the S&P 500 has gained an average of 14.5%. Since the current pause began, after the Fed last raised rates on July 26, 2023, the S&P 500 has gained over 23% — besting the performance in all prior cycles going back 40 years. If this cycle is similar, and the first rate cut by the Fed comes in September, as we expect (we expect two this year), then stocks may struggle to add much to first-half gains over the next several months.
For those who think a rate cut might spark another leg up in this rally, it’s certainly possible, but it depends on the market’s interpretation of the reason for the cut. In the first three months after initial rate cuts in 1981, 2001, and 2007, economic woes sent stocks lower. But in 1984, 1989, 1995, and 2019, in relatively healthy economies, the S&P 500 rose. So, time will tell.
Potential sources of volatility in the second half. The most worrisome risks are the ones the market isn’t prepared for. Geopolitics or election uncertainty are likely sources of volatility, but that’s casting a wide net. The attempted assassination of former President Trump over the weekend certainly adds uncertainty (we wish Mr. Trump well in his recovery).
Bottom line, the data suggests a pullback is overdue. The average maximum drawdown in a positive year, which 2024 will almost certainly be, is 11%. Even after strong first halves, 10% corrections are typical, election or no election. So far in 2024, the maximum drawdown for the index has been just 5.5%, suggesting more volatility may be coming despite the improving inflation picture.
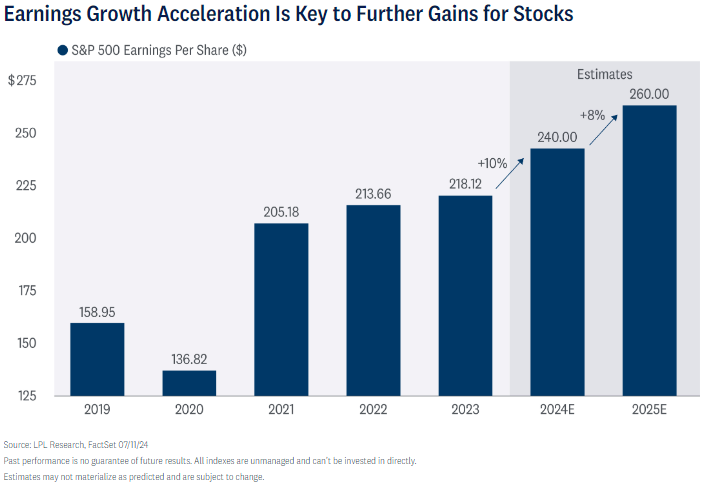
Earnings are on the upswing. Earnings growth is accelerating and approaching double-digits as second quarter earnings season gets underway (we previewed earnings season in Double-Digit Earnings Growth on Tap). With valuations elevated, earnings must hold up, and they have been doing their part. Solid economic growth, supply chain normalization, effective cost control, and investment in AI have helped fuel the strong rebound in earnings this year and led us to raise our S&P 500 earnings per share (EPS) forecasts for 2024 and 2025 to $240 and $260, from $235 and $250. Those forecasts may seem optimistic, but a high-single-digit increase is near the long-term averages. An expected reversal of declines in healthcare and natural resource sector profits and additional investment in AI help bolster the earnings outlook.
A LOT OF GOOD NEWS IS PRICED IN
At a price-to-earnings ratio (P/E) of around 21, based on the consensus EPS estimate for the S&P 500 over the next 12 months, stocks seem expensive, and a lot of good news is already priced in (the average S&P 500 P/E over the past 25 years is 17).
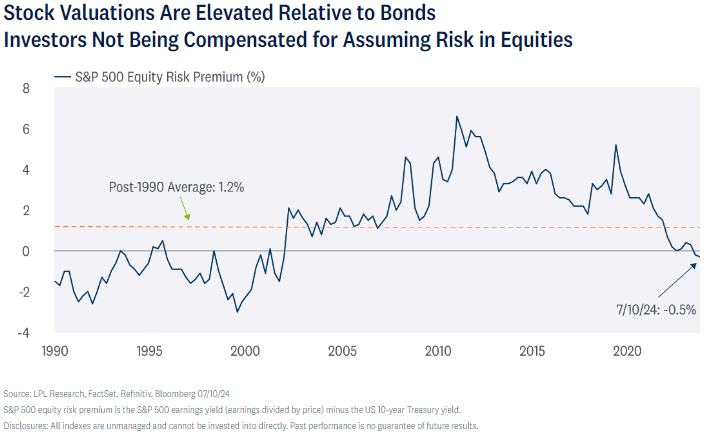
Comparing yields from fixed income to earnings from stocks, investors are being minimally compensated for taking on equity risk relative to Treasury yields. And for those thinking lower Treasury yields may prop up valuation, we expect only minimal downside to long-term Treasury yields from current levels.
Bottom line, forecasting anything better than modest upside in equities requires relaxing any valuation discipline, something we certainly do not want to do, though we do acknowledge valuations statistically have very little predictive power over short time periods. That puts the onus on earnings upside, which won’t be easy now that the bar has been raised.
HOW TO THINK ABOUT OUR YEAR-END FAIR VALUE S&P 500 TARGET
LPL Research has decided to leave its year-end fair value S&P 500 target at 4,950 for now, though current valuations do support a target near current levels. It is common for stocks to trade above fair value for extended periods of time.
An expected further easing in inflation, stable if not lower interest rates, and a steady earnings trajectory support a higher target on paper — the current P/E ratio of 21 times and our 2025 S&P 500 EPS estimate of $260 translate to an estimated fair-value range for the S&P 500 at the end of 2024 near 5,500.
However, this doesn’t take into account volatility. Given heightened geopolitical threats, U.S. election uncertainty, and other idiosyncratic structural factors, we expect market volatility to rise in the second half of the year. Factoring this into our view, we prefer to wait to reassess our year-end target range after a potential pullback or correction and will consider adding equities exposure on a dip. If these risks do not upend markets in the coming months, it is not difficult to make a case for a little bit of valuation expansion and upside to $260 in S&P 500 EPS, which could get us over 5,800 by year end.
ASSET ALLOCATION INSIGHTS
The LPL Strategic and Tactical Asset Allocation Committee (STAAC) maintains its recommended neutral equities allocation amid a favorable economic and profit backdrop. Interest rates may need to fall for valuations to hold, so potential second-half gains are more likely to be driven by earnings growth. The Committee remains comfortable with a balanced approach to market cap. High-quality small cap stocks are attractively valued, but the earnings power among large cap companies overall, has been very impressive. The Committee maintains a slight preference towards large cap growth. AI-fueled earnings growth, potentially lower interest rates as the economy slows, and our technical analysis work favors the growth style. Finally, the STAAC’s regional preference remains U.S. over developed international and emerging markets (EM) due largely to superior earnings and economic growth in the U.S.
The STAAC continues to recommend a modest overweight to fixed income, funded from cash, with a strong overweight tilt in preferred securities as valuations remain attractive and a recommended neutral duration posture relative to benchmarks. The risk/reward for core bond sectors (U.S. Treasury, agency mortgage-backed securities (MBS), investment-grade corporates) is more attractive than plus sectors.
IMPORTANT DISCLOSURES
This material is for general information only and is not intended to provide specific advice or recommendations for any individual. There is no assurance that the views or strategies discussed are suitable for all investors or will yield positive outcomes. Investing involves risks including possible loss of principal. Any economic forecasts set forth may not develop as predicted and are subject to change.
References to markets, asset classes, and sectors are generally regarding the corresponding market index. Indexes are unmanaged statistical composites and cannot be invested into directly. Index performance is not indicative of the performance of any investment and do not reflect fees, expenses, or sales charges. All performance referenced is historical and is no guarantee of future results.
Any company names noted herein are for educational purposes only and not an indication of trading intent or a solicitation of their products or services. LPL Financial doesn’t provide research on individual equities.
All information is believed to be from reliable sources; however, LPL Financial makes no representation as to its completeness or accuracy.
US Treasuries may be considered “safe haven” investments but do carry some degree of risk including interest rate, credit, and market risk. Bonds are subject to market and interest rate risk if sold prior to maturity. Bond values will decline as interest rates rise and bonds are subject to availability and change in price.
The Standard & Poor’s 500 Index (S&P500) is a capitalization-weighted index of 500 stocks designed to measure performance of the broad domestic economy through changes in the aggregate market value of 500 stocks representing all major industries.
The PE ratio (price-to-earnings ratio) is a measure of the price paid for a share relative to the annual net income or profit earned by the firm per share. It is a financial ratio used for valuation: a higher PE ratio means that investors are paying more for each unit of net income, so the stock is more expensive compared to one with lower PE ratio.
Earnings per share (EPS) is the portion of a company’s profit allocated to each outstanding share of common stock. EPS serves as an indicator of a company’s profitability. Earnings per share is generally considered to be the single most important variable in determining a share’s price. It is also a major component used to calculate the price-to-earnings valuation ratio.
All index data from FactSet.
Value investments can perform differently from the market as a whole. They can remain undervalued by the market for long periods of time.
The prices of small cap stocks are generally more volatile than large cap stocks.
International investing involves special risks such as currency fluctuation and political instability and may not be suitable for all investors. These risks are often heightened for investments in emerging markets.
LPL Financial does not provide investment banking services and does not engage in initial public offerings or merger and acquisition activities.
This research material has been prepared by LPL Financial LLC.
Securities and advisory services offered through LPL Financial (LPL), a registered inv estment advisor and broker -dealer (member FINRA/SIPC). Insurance products are offered through LPL or its licensed affiliates. To the extent you are receiving investment a dvice from a separately registered independent investment advisor that is not an LPL affiliate, please note LPL makes no representation with respect to such entity.
Not Insured by FDIC/NCUA or Any Other Government Agency | Not Bank/Credit Union Guaranteed | Not Bank/Credit Union Deposits or Obligations | May Lose Value
RES-00015170-0624W | For Public Use | Tracking #602541 (Exp. 07/2025)